Effect of Different Aging Temperatures and Time on Alloy Microstructure
On this page
Effect of Different Aging Temperatures on Alloy Microstructure
Figure 2 shows the metallographic structure of the AlSi7CuMnMg alloy at different aging temperatures after holding for 6 hours. It can be seen that the microstructure of the alloy under different aging systems does not differ significantly. The microstructure is mainly composed of a large number of white blocky and rod-shaped α-Al matrix and fine black granular and lamellar α-Al+Si eutectic silicon. The eutectic silicon phase is distributed along the grain boundaries, and the size distribution between grains is uneven. The clustered α-Al is generated when the alloy enters the pressure chamber. Due to the slow cooling rate, the grains have enough time to grow, resulting in a larger size and clear dendritic characteristics. However, when α-Al is formed, its cooling and solidification rate is relatively fast, leading to a fine granular and equiaxed structure, as shown in Figure 4d. In addition, small amounts of light gray, fine, round manganese-containing phases are present in the metallographic structure. In the cast state, these manganese-containing phases are small in size and primarily distributed along the grain boundaries. After low-temperature artificial aging treatment, the manganese-containing phases gradually grow, aggregate, and coarsen. The aggregation of these fine manganese-containing phases can pin dislocations, hinder their movement during deformation, and improve the yield strength of the die-cast part.
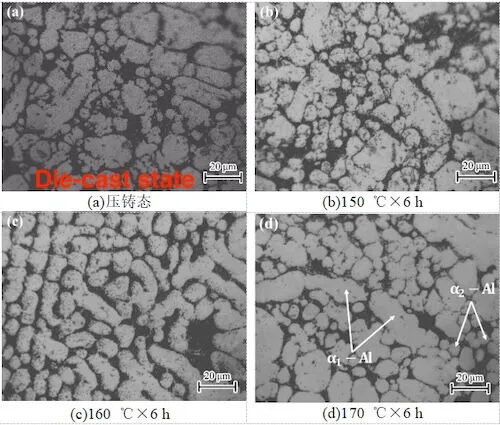
Figure 2 Metallographic structure (OM) of AlSi7CuMnMg alloy at different aging temperatures
Figure 3 shows the scanning organization diagram of the AlSi7CuMnMg alloy in different states, where Figures 3d, 3e, and 3f display the main element surface distribution of the alloy in the cast state, at 150°C for 6 hours, and at 170°C for 6 hours, respectively. It can be observed that the dark gray represents the α-Al matrix, the Si element is dispersed in the form of light gray lamellae at the grain boundary, and the bright white area is the second phase, primarily containing Cu, Mg, and Mn. After low-temperature aging treatment, the eutectic silicon is more evenly dispersed in the matrix, and its lamellar spacing gradually decreases. Mn appears as small white dots, as shown in Figure 5b. As the aging temperature increases, Mn becomes enriched at the grain boundary, forming a strengthening phase. The distribution of Cu and Mg in the cast state is not pronounced. After low-temperature aging at 170°C for 6 hours, they begin to gather and precipitate at the grain boundary, as shown in Figure 5c.
Generally, hypoeutectic AlSiCuMg alloys precipitate strengthening phases such as the β-Mg2Si phase and α-Al2Cu during the aging process to improve their strength. Figure 3 shows the EDS spectrum component analysis of each point, and Figure 4 displays the X-ray diffraction spectrum of the alloy in different states. Based on the molar ratio, it was determined that point 1 is the α-Al matrix, point 2 is α-Al+Si eutectic silicon, and points 3 to 6 represent white bright spots under different heat treatment conditions. Energy spectrum analysis shows that points 3, 4, and 5 are manganese-containing phases, with increasing manganese content across the phases. According to the diffraction spectrum results in Figure 6, the phase is identified as Al4.01MnSi0.74, and the Cu and Mg content in point 6 is significantly increased.
The strengthening effect of Cu in aluminum-silicon alloys is dependent on its interaction with Mg, leading to the precipitation of phases such as Q-Al5Cu2Mg8Si6 and W-Al2Si5Cu4Mg4. However, due to the small proportion of Cu and Mg in the AlSi7CuMnMg alloy composition, these strengthening phases were not detected in the X-ray diffraction spectrum. Based on Table 5, after low-temperature aging treatment at 170°C for 6 hours, the strengthening phase that may exist in the matrix is W-Al2Si5Cu4Mg4. Due to the high speed and pressure in the die-casting process and the mold's chilling effect, solute atoms such as Cu, Mg, and Mn do not fully precipitate in the matrix during solidification. As the aging process proceeds, the solute atoms continue to dissolve, forming segregated G.P. zones that maintain a coherent relationship with the parent phase. As the aging temperature increases, the segregated zones transform into metastable transition phases, which are semi-coherent with the parent phase, causing lattice distortion and hindering dislocation movement.
The yield strength of the alloy continues to increase, reaching the peak aging state at 180°C. When the aging temperature is further increased, the transition phase transforms into a larger stable equilibrium phase, which is completely incoherent with the parent phase and has higher interfacial energy. Dislocations move through the Orowan bypass mechanism. The strength of the alloy decreases as the dissolved phase size increases, entering the over-aging stage. This is evident as the yield strength of the alloy decreases from 189 MPa to 183 MPa when the aging temperature increases from 180°C to 190°C.
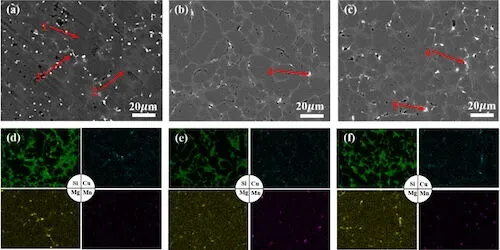
Figure 3 SEM structure of AlSi7CuMnMg alloy under different conditions
Table 5 EDS spectrum results of each point in Figure 5

Figure 2 Metallographic structure (OM) of AlSi7CuMnMg alloy at different aging temperatures
Figure 3 shows the scanning organization diagram of the AlSi7CuMnMg alloy in different states, where Figures 3d, 3e, and 3f display the main element surface distribution of the alloy in the cast state, at 150°C for 6 hours, and at 170°C for 6 hours, respectively. It can be observed that the dark gray represents the α-Al matrix, the Si element is dispersed in the form of light gray lamellae at the grain boundary, and the bright white area is the second phase, primarily containing Cu, Mg, and Mn. After low-temperature aging treatment, the eutectic silicon is more evenly dispersed in the matrix, and its lamellar spacing gradually decreases. Mn appears as small white dots, as shown in Figure 5b. As the aging temperature increases, Mn becomes enriched at the grain boundary, forming a strengthening phase. The distribution of Cu and Mg in the cast state is not pronounced. After low-temperature aging at 170°C for 6 hours, they begin to gather and precipitate at the grain boundary, as shown in Figure 5c.
Generally, hypoeutectic AlSiCuMg alloys precipitate strengthening phases such as the β-Mg2Si phase and α-Al2Cu during the aging process to improve their strength. Figure 3 shows the EDS spectrum component analysis of each point, and Figure 4 displays the X-ray diffraction spectrum of the alloy in different states. Based on the molar ratio, it was determined that point 1 is the α-Al matrix, point 2 is α-Al+Si eutectic silicon, and points 3 to 6 represent white bright spots under different heat treatment conditions. Energy spectrum analysis shows that points 3, 4, and 5 are manganese-containing phases, with increasing manganese content across the phases. According to the diffraction spectrum results in Figure 6, the phase is identified as Al4.01MnSi0.74, and the Cu and Mg content in point 6 is significantly increased.
The strengthening effect of Cu in aluminum-silicon alloys is dependent on its interaction with Mg, leading to the precipitation of phases such as Q-Al5Cu2Mg8Si6 and W-Al2Si5Cu4Mg4. However, due to the small proportion of Cu and Mg in the AlSi7CuMnMg alloy composition, these strengthening phases were not detected in the X-ray diffraction spectrum. Based on Table 5, after low-temperature aging treatment at 170°C for 6 hours, the strengthening phase that may exist in the matrix is W-Al2Si5Cu4Mg4. Due to the high speed and pressure in the die-casting process and the mold's chilling effect, solute atoms such as Cu, Mg, and Mn do not fully precipitate in the matrix during solidification. As the aging process proceeds, the solute atoms continue to dissolve, forming segregated G.P. zones that maintain a coherent relationship with the parent phase. As the aging temperature increases, the segregated zones transform into metastable transition phases, which are semi-coherent with the parent phase, causing lattice distortion and hindering dislocation movement.
The yield strength of the alloy continues to increase, reaching the peak aging state at 180°C. When the aging temperature is further increased, the transition phase transforms into a larger stable equilibrium phase, which is completely incoherent with the parent phase and has higher interfacial energy. Dislocations move through the Orowan bypass mechanism. The strength of the alloy decreases as the dissolved phase size increases, entering the over-aging stage. This is evident as the yield strength of the alloy decreases from 189 MPa to 183 MPa when the aging temperature increases from 180°C to 190°C.

Figure 3 SEM structure of AlSi7CuMnMg alloy under different conditions
Table 5 EDS spectrum results of each point in Figure 5
| Energy Spectrum Point | Al (%) | Si (%) | Mn (%) | Cu (%) | Mg (%) | Phase |
| 1 | 98.2 | 1.4 | - | 0.1 | 0.2 | α-Al matrix |
| 2 | 78.7 | 19.6 | - | 0.6 | 1.0 | α-Al+Si eutectic silicon |
| 3 | 85.1 | 9.0 | 4.1 | 0.2 | 0.2 | Al4.01MnSi0.74 phase |
| 4 | 77.2 | 15.0 | 7.3 | 0.2 | 0.2 | Al4.01MnSi0.74 phase |
| 5 | 75.7 | 14.2 | 9.7 | 0.3 | 0.1 | Al4.01MnSi0.74 phase |
| 6 | 77.6 | 9.5 | 0.4 | 7.0 | 5.4 | Copper magnesium phase |
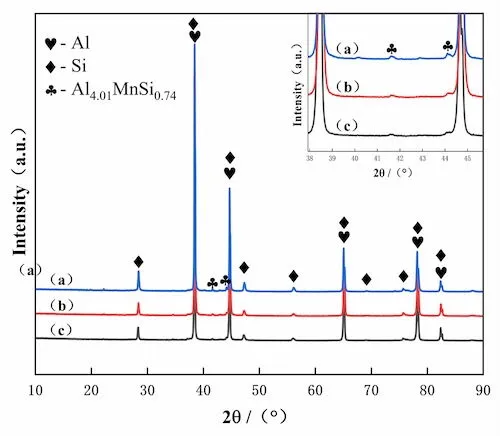
Figure 4 X-ray diffraction spectrum of AlSi7CuMnMg alloy under different conditions
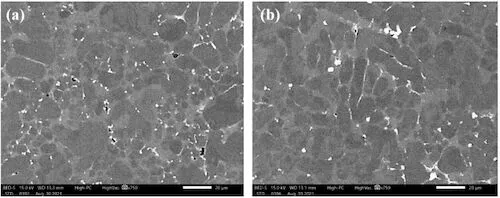
Figure 5 SEM structure of AlSi7CuMnMg alloy
To further analyze the changes in the second phase of the alloy after aging treatment, the grain size and area fraction of the second phase in the alloy structure in Figure 5 were statistically analyzed using Image-Pro Plus software, and the results are presented in Table 6. As seen in Table 6, after aging treatment, the number of second-phase particles distributed in the matrix decreases, while their size increases, with the maximum reaching 6.27. The average grain size increases from 1.11 in the cast state to 2.01 after aging. The second phase is mainly concentrated in block and point forms at the junction of each grain, with a few distributed in a network along the grain boundaries. After the alloy is aged at 170°C for 6 hours, the second-phase particles gather and grow between the α-Al matrix and the eutectic silicon phase, more effectively pinning dislocations. Simultaneously, dislocations cut through the second-phase particles, increasing interfacial energy and effectively improving yield strength. However, as the second phase aggregates and coarsens, the alloy's plasticity gradually decreases.
Table 6 Statistics of the second phase grain size and area fraction in Figure 5
| Sample State | Average Size /(μm) | Maximum Size /(μm) | Area Fraction /(%) | Statistical Quantity |
| Cast State | 1.11 | 3.65 | 2.21 | 262 |
| 170°C × 6 h | 2.01 | 6.27 | 1.39 | 119 |
Figure 7 compares the fracture morphology of the AlSi7CuMnMg alloy under various conditions after room temperature tensile testing. Figures 8a to 8c show thick strip-shaped tearing edges, and several alternately distributed tearing edges form a river-like fracture morphology. At high magnification, a large cleavage plane is visible. Tensile deformation causes stress concentration at defects, leading to the formation of microcracks. The crack initially grows within the grain and then expands along the grain boundary to adjacent grains, forming a dissociation plane, a characteristic of brittle fracture. There are also shallow, small, and sparse dimples. The size of the dimples is determined by the material’s plastic deformation capability and the size and density of the second phase. This indicates that the fracture mode of AlSi7CuMnMg alloy at room temperature after low-temperature aging is a mixed fracture. A typical micro-shrinkage morphology is observed in the fracture structure shown in Figure 8f. This results from the shrinkage of molten metal during solidification in the die casting process. Because of the uneven cooling rate, the casting surface and areas near the mold cool and solidify rapidly, hindering the subsequent shrinkage of the molten metal. This results in shrinkage holes inside the casting, adversely affecting the alloy’s mechanical properties.
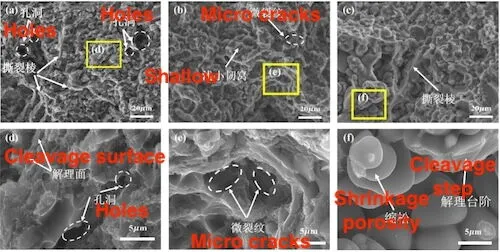
Figure 6 Fracture morphology of AlSi7CuMnMg alloy after room temperature stretching under different conditions (SEM)
Effect of Different Aging Time on Alloy Structure
The metallographic microstructure of the alloy after different holding times at 170℃ is shown in Figure 7. The matrix structure is divided into primary 1-Al and secondary 2-Al, presented in various forms such as coarse blocks, irregular clusters, and small circles. The eutectic silicon phase is distributed in tree-like and strip-like forms along the grain boundaries. Additionally, there is a certain degree of Si segregation, which negatively affects the alloy’s properties. As the aging time increases, the second-phase particles at the grain boundaries continue to accumulate and coarsen. When dislocations slip, they interact with these second-phase particles, hindering further dislocation slip and causing the yield strength of the material to increase. The second-phase particles are distributed within the matrix and at the grain boundaries, increasing the unevenness and incoordination of material deformation, thus reducing the material’s plasticity.
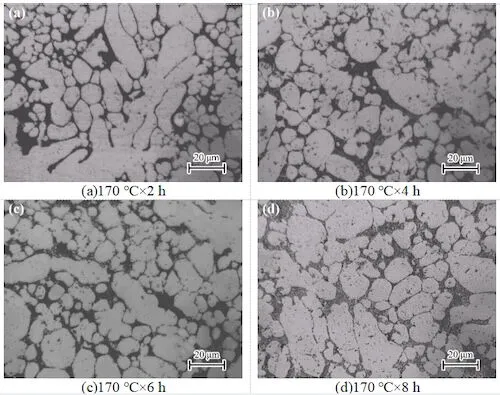
Figure 7 Metallographic structure (OM) of AlSi7CuMnMg alloy at different aging times

Figure 7 Metallographic structure (OM) of AlSi7CuMnMg alloy at different aging times
Conclusion
(1) As the aging temperature increases, the yield strength of AlSi7CuMnMg aluminum-silicon alloy increases significantly, reaching 189MPa at 180 ℃, but the elongation decreases. Keeping the aging temperature constant while extending the aging time, the yield strength increases even further, reaching 198MPa at 10 h, though the tensile strength remains largely unchanged.
(2) Taking into account various mechanical properties, the optimal low-temperature aging process for AlSi7CuMnMg die-cast aluminum-silicon alloy is 170℃ for 6 hours. In this state, the yield strength reaches 183MPa, which is 40.77% higher than the original cast sample, the elongation is 7.5%, and the strengthening and toughening index reaches its highest value of 1.039.
(3) During the aging process, the second phase accumulates and coarsens, pinning dislocations at the grain boundaries. This increases the material’s resistance to deformation and effectively improves the alloy’s strength.